What you will learn
Choose a useful data split and interpret precision and recall in the context of a task.
Before you begin: Masks, patches and attention
Change the scene, not just the filename
A model can look impressive when test images resemble its training images too closely. Adjacent video frames are a common trap: split them randomly and nearly identical scenes can land on both sides. Consider separating by recording session, location, subject or time, according to the intended use. The right split represents the kind of new situation the system will encounter. It is part of the experimental design, not a housekeeping choice at the end.
Read the two kinds of mistake
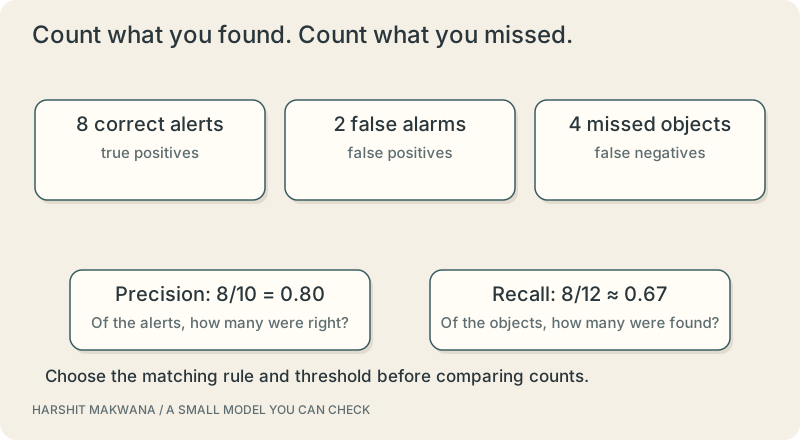
Suppose a detector raises ten alerts. Eight are correct, and two are false alarms. Its precision is eight out of ten. If there were twelve real objects it should have found, its recall is eight out of twelve. Neither fraction tells the whole story. If a missed object is costly, you may accept more false alarms. If every alert interrupts a person, that tradeoff changes. Choose thresholds using validation data and the actual task costs.
Look at slices, not only averages
Separate results for dim lighting, small objects, motion blur and unfamiliar backgrounds. A strong overall average can conceal a weak region of the problem. Keep a small error gallery with the input, reference, prediction and a short note about what went wrong. The goal is not to collect embarrassing pictures; it is to decide whether better data, a different task definition or a model change would address the failure. Sometimes the camera setup is the real bottleneck.
Remember the rest of the system
A deployed pipeline also decodes images, resizes them, transfers data and applies postprocessing. Measure latency at the boundary your user experiences. Record hardware and input size, and keep evaluation data separate from decisions made during development. After release, changing lighting or camera position can shift the input distribution. A useful system therefore needs a way to notice degradation and review failures. A polished demo is the beginning of this work, not its conclusion.
SEE THE RELATIONSHIPS
From structure to behavior.
MAKE THE IDEA PRECISE
The mathematics.
| Symbol | Meaning |
|---|---|
| TP | Correct detections under a stated matching rule |
| FP | Unmatched or incorrect detections |
| FN | Labelled objects that were missed |
Build the equation, step by step
- Define how a prediction is matched to a reference, including class and localisation requirements.
- Divide true positives by all positive predictions for precision; divide by all reference positives for recall.
- Keep the threshold, matching policy and evaluation split with the result. Handle zero denominators explicitly when a dataset slice has no predictions or no positives.
WORK THROUGH THE NUMBERS
Worked example
With TP=8, FP=2 and FN=4, precision is 0.80 and recall is about 0.67. These are invented counts for learning the arithmetic; the generated still-life image is not a validation dataset.
A small Python experiment.
Python 3 · Standard library only · Synthetic educational example. Run this in your own notebook or a local file.
tp, fp, fn = 8, 2, 4
print(f"precision = {tp/(tp+fp):.2f}")
print(f"recall = {tp/(tp+fn):.2f}")
Expected output
precision = 0.80
recall = 0.67
Change one quantity, predict the result, and then run the code again. Explain any difference before adding complexity.
Test your understanding.
Try it: Design an error-gallery template with scene, expected output, actual output, failure category and the next experiment.
Self-check: Can you improve recall simply by accepting more predictions?
You may increase recall by lowering a score threshold, but false positives may also rise. The exact curve depends on the model and matching rules. Choose a tradeoff on validation data, then report performance on held-out data without retuning the threshold on that final test.
Where this model stops: The lesson defines an evaluation practice, not a production guarantee. No trained model, private dataset or live camera is connected.
A research question: Keep one assumption fixed and change another. What observation would make you revise your explanation?
Record evidence in your mastery worksheet →Read with the original sources.
These readings support the concepts and deeper investigation. The worked numbers and illustrations above are teaching examples.
Primary source / official teaching material
Redmon et al. — You Only Look Once ↗
The original YOLO paper explains joint box and class prediction. This guide does not claim to document every later YOLO version.
Primary source / official teaching material
Stanford CS231n — Convolutional neural networks ↗
Reference for local receptive fields, shared filters and convolutional network structure.