What you will learn
Explain masks and patch tokens, then measure overlap in a small segmentation example.
Before you begin: From features to objects
The empty space inside a box
A rectangle around a mug includes background. If you want to estimate its visible area or separate it from the table, you need a more detailed answer. Semantic segmentation assigns a class to each pixel. Instance segmentation also separates different objects of the same class. These are different tasks: identifying all cup-shaped pixels is not the same as deciding which pixels belong to which individual cup. Choose the output your application actually needs.
Keep detail while gathering context
A segmentation network needs context to recognise an object and spatial detail to locate its boundary. U-Net offers a clear architectural example: an encoder builds representations at reduced resolutions, a decoder reconstructs a spatial prediction, and connections across matching resolutions supply useful detail. That structure does not eliminate ambiguity. A blurred edge or an occluded surface may simply contain insufficient information for an exact answer. A crisp-looking mask can still be wrong.
Another way to organise the image
A Vision Transformer divides an image into patches, represents them as tokens and adds position information. Attention lets token representations depend on other tokens according to learned relationships. This gives us another way to mix information across an image. It does not mean that an attention map automatically explains the model’s reasoning, or that transformers always beat convolutional networks. The data, objective, training and resource budget remain part of the comparison.
Evaluate the pixels you predict
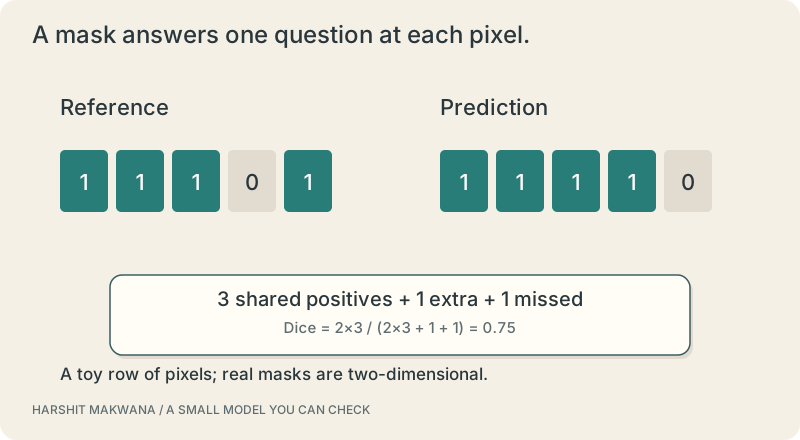
For a binary mask, count pixels marked positive correctly, pixels predicted positive incorrectly and positive pixels that were missed. Dice compares twice the overlap with the sum of predicted and true positive areas. The little example below is small enough to count with your finger. Before trusting a reported score, decide how empty masks, multiple classes and separate images are aggregated. Those choices can materially change the meaning of a seemingly simple number.
SEE THE RELATIONSHIPS
From structure to behavior.
MAKE THE IDEA PRECISE
The mathematics.
| Symbol | Meaning |
|---|---|
| TP | Pixels correctly predicted positive |
| FP | Pixels predicted positive but labelled negative |
| FN | Positive pixels missed by the prediction |
Build the equation, step by step
- The predicted positive area is TP+FP, and the true positive area is TP+FN.
- Add those two areas and place twice the intersection, 2TP, in the numerator.
- For TP=3, FP=1 and FN=1, the score is 6/8=0.75. If both masks are empty, specify your convention explicitly.
WORK THROUGH THE NUMBERS
Worked example
Compare [1,1,1,1,0] with the reference [1,1,1,0,1]. Three positive pixels overlap, one is extra and one is missed. Dice is 0.75. This measures agreement with the chosen reference, not the certainty that the reference is correct.
A small Python experiment.
Python 3 · Standard library only · Synthetic educational example. Run this in your own notebook or a local file.
truth = [1, 1, 1, 0, 1]
pred = [1, 1, 1, 1, 0]
tp = sum(t == 1 and p == 1 for t, p in zip(truth, pred))
fp = sum(t == 0 and p == 1 for t, p in zip(truth, pred))
fn = sum(t == 1 and p == 0 for t, p in zip(truth, pred))
print(f"Dice = {2*tp/(2*tp+fp+fn):.2f}")
Expected output
Dice = 0.75
Change one quantity, predict the result, and then run the code again. Explain any difference before adding complexity.
Test your understanding.
Try it: Construct two predictions with the same Dice but different error locations. Which would be more troublesome for your intended task?
Self-check: Does a good average mask score guarantee useful boundaries?
No. A large region can dominate an overlap measure while a small but important boundary remains inaccurate. Inspect errors at the scale that matters to the task, consider complementary metrics, and document the quality and uncertainty of the reference labels.
Where this model stops: The binary toy mask does not reproduce a trained U-Net or transformer. Architecture descriptions are conceptual, not implementation or benchmark claims.
A research question: Keep one assumption fixed and change another. What observation would make you revise your explanation?
Record evidence in your mastery worksheet →Read with the original sources.
These readings support the concepts and deeper investigation. The worked numbers and illustrations above are teaching examples.
Primary source / official teaching material
Ronneberger et al. — U-Net ↗
A primary example of an encoder-decoder segmentation network with connections between resolutions.
Primary source / official teaching material
Dosovitskiy et al. — An Image is Worth 16x16 Words ↗
The original Vision Transformer paper introduces image-patch tokens for transformer-based classification.