What you will learn
Distinguish classification from detection and calculate the overlap between two boxes.
Before you begin: A picture is a grid
Ask a more precise question
Classification asks what an image contains. Detection also asks where each instance is. A picture can contain a mug, a pear and a camera at once; one label for the whole picture is not enough when a robot needs to locate the mug. A detector commonly returns a class, a score and a bounding box for each candidate. Those outputs describe a prediction. They do not guarantee that the object is there or that the box fits it well.
Features provide the working material
A convolutional network applies learned filters and nonlinearities to create feature maps. Shared filter weights let the same local pattern be considered at different positions. Deeper representations can combine information over larger image regions. It is tempting to say that each layer cleanly recognises edges, then parts, then objects. That is a useful sketch, but real representations are distributed and depend on the model and training task. Do not mistake the sketch for a literal inventory of neurons.
A box needs a coordinate agreement
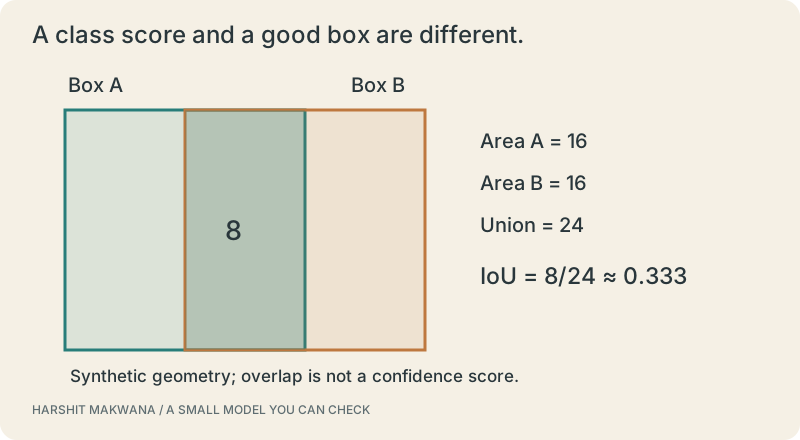
Suppose one box starts at (0,0) and ends at (4,4), while another starts at (2,0) and ends at (6,4). To compare them, first agree on what those coordinates mean. Here they are continuous rectangle boundaries, so width is right minus left. Their overlap is only two units wide. Intersection-over-union compares that overlapping area with the total area covered by either box. It gives geometry a clearer role than simply asking whether the boxes look close.
Separate the score from the fit
A detector may be confident about the class while placing the box poorly. It may also produce several boxes around the same object. Postprocessing often deals with duplicates, but thresholds change the tradeoff between missed objects and false alarms. The original YOLO paper is an important example of predicting boxes and classes in one network. The calculation below is deliberately independent of any specific detector: it lets you check the geometry before judging a model.
SEE THE RELATIONSHIPS
From structure to behavior.
MAKE THE IDEA PRECISE
The mathematics.
| Symbol | Meaning |
|---|---|
| IoU | Intersection over union, from 0 to 1 for nonempty valid rectangles |
| Union | area A + area B − intersection |
| Coordinates | Continuous rectangle boundaries in the same coordinate system |
Build the equation, step by step
- Intersection width is max(0, min(right edges) − max(left edges)); use the same rule for height.
- Multiply width by height. Compute the union by adding both box areas and subtracting the overlap once.
- Divide intersection by union when the union is positive. Define a separate policy for degenerate boxes rather than silently dividing by zero.
WORK THROUGH THE NUMBERS
Worked example
Both boxes have area 16. Their intersection is 2×4=8, and their union is 16+16−8=24. The IoU is 8/24≈0.333. A class score of 0.99 would not change this geometric result.
A small Python experiment.
Python 3 · Standard library only · Synthetic educational example. Run this in your own notebook or a local file.
a, b = (0, 0, 4, 4), (2, 0, 6, 4)
w = max(0, min(a[2], b[2])-max(a[0], b[0]))
h = max(0, min(a[3], b[3])-max(a[1], b[1]))
intersection = w*h
area_a = (a[2]-a[0])*(a[3]-a[1])
area_b = (b[2]-b[0])*(b[3]-b[1])
print(f"IoU = {intersection/(area_a+area_b-intersection):.3f}")
Expected output
IoU = 0.333
Change one quantity, predict the result, and then run the code again. Explain any difference before adding complexity.
Test your understanding.
Try it: Move the second box until it is identical to the first, then until the boxes do not overlap. Check the two limiting IoUs.
Self-check: Does a high confidence score imply a well-localised box?
No. Confidence and geometric fit are different properties. A model can assign a high class score to a poorly placed box. Evaluate class correctness and localisation under a defined matching protocol, and inspect difficult examples instead of relying on one score.
Where this model stops: These are synthetic rectangles, not detector output on the editorial photograph. No inference model is running in the page.
A research question: Keep one assumption fixed and change another. What observation would make you revise your explanation?
Record evidence in your mastery worksheet →Read with the original sources.
These readings support the concepts and deeper investigation. The worked numbers and illustrations above are teaching examples.
Primary source / official teaching material
Stanford CS231n — Convolutional neural networks ↗
Reference for local receptive fields, shared filters and convolutional network structure.
Primary source / official teaching material
Redmon et al. — You Only Look Once ↗
The original YOLO paper explains joint box and class prediction. This guide does not claim to document every later YOLO version.