What you will learn
Write a provenance-aware neuron dossier and trace a pathway with evidence for each connection.
Before you begin: Connectomics: wiring as data; From neurons to brains
Locate the question in the animal
The fly nervous system includes the brain and the ventral nerve cord. Descending neurons connect brain processing toward body-related circuitry; ascending pathways carry information in the opposite broad direction. A dataset must be interpreted by specimen, sex, reconstructed volume and release. A neuron identifier is meaningful within that context, not a universal name that can be copied between every connectome.
Visual pathways are branched
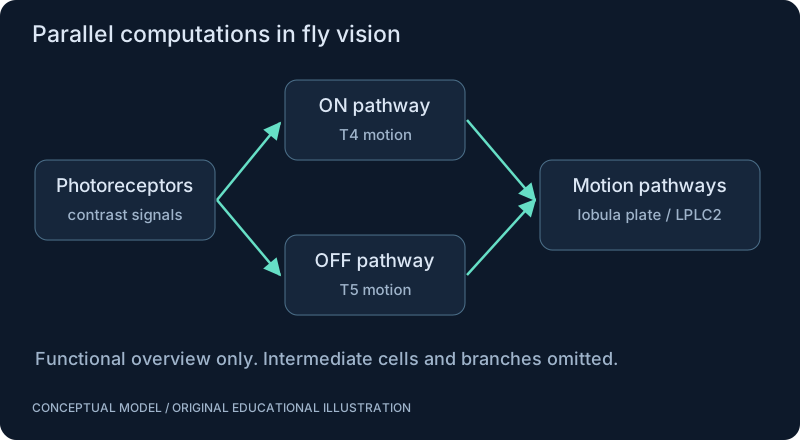
The retina, lamina, medulla, lobula and lobula plate are anatomical terms, not interchangeable processing layers. Experimental work distinguishes T4 and T5 motion responses, including ON/OFF selectivity. The simplified figure separates these streams and a looming-related branch; it does not claim that every visual signal passes through one serial route. LPLC2 studies provide a focused example of relating structure to selectivity.
Build an evidence dossier
For a cell type, record location, morphology, known input/output partners, evidence for function, and uncertainty. Distinguish an anatomical edge from a measured response and a causal perturbation. If a source only predicts a neurotransmitter, keep the word predicted. Robotics relevance is an engineering hypothesis, not a biological function assigned to the cell.
From anatomy to modeling
Before simulating a chosen subcircuit, count which partners lie outside your selection. Cutting a graph changes its inputs and feedback. A normalized edge fraction is useful for auditing a selection, but it is not an experimentally measured probability of signal transmission. Start with a small, inspectable subset rather than interpreting a whole-brain visualization as understanding.
SEE THE RELATIONSHIPS
From structure to behavior.
MAKE THE IDEA PRECISE
The mathematics.
| Symbol | Meaning |
|---|---|
| c_ij | Illustrative synapse count from i to j |
| f_ij | Fraction of counted outgoing synapses assigned to j |
| k | Index over included targets |
Build the equation, step by step
- Pick one source cell i and a defined set of targets. Sum its counted contacts to obtain the denominator.
- Divide each target count by that sum. When the sum is positive, fractions over the selected targets add to one.
- Changing the selected target set changes the fractions. An empty or zero-contact row requires an explicit missing-data policy rather than division by zero.
WORK THROUGH THE NUMBERS
Worked example
A synthetic source has outgoing counts 2, 3 and 5. Their normalized fractions are 0.2, 0.3 and 0.5. They sum to one because of the normalization, not because a biological signaling law was discovered.
A small Python experiment.
Python 3 · Standard library only · Synthetic educational example. Run this in your own notebook or a local file.
counts = [2, 3, 5]
fractions = [value/sum(counts) for value in counts]
print(fractions)
print(sum(fractions))
Expected output
[0.2, 0.3, 0.5]
1.0
Change one quantity, predict the result, and then run the code again. Explain any difference before adding complexity.
Test your understanding.
Try it: Remove the target with count 5. Explain why renormalizing the remaining targets changes interpretation.
Self-check: Does a normalized contact fraction equal a firing probability?
No. It is a fraction of counted contacts within the selected data, not a measured transfer function. A model can use it as a chosen weight, but that assumption needs testing and comparison against alternatives.
Where this model stops: This edition does not provide an exhaustive cell-type atlas or a newly reconstructed connectome.
A research question: Which functional claims need activity measurements or perturbations beyond connectivity?
Record evidence in your mastery worksheet →THE NEXT LAYER
Chapter depth map.
This introduction provides a first model. The following chapters are outlines for deeper future editions; their full treatments have not yet been published.
A nervous system in context
5.1 Brain, body and public maps · Outline
- 5.1.1 Brain and ventral nerve cord; ascending and descending neurons
- 5.1.2 FlyWire and MaleCNS: specimen, scope, version and access
- 5.1.3 Brain regions, neuropils, cell types and stable identifiers
- 5.1.4 Olfactory pathways, mushroom body and navigation circuits
- 5.1.5 Compare datasets without equating IDs across specimens
5.2 The visual system · Outline
- 5.2.1 Photoreceptors and retinal sampling
- 5.2.2 Lamina, medulla, lobula and lobula plate
- 5.2.3 ON/OFF pathways and T4/T5 direction selectivity
- 5.2.4 Visual projection neurons and distinct LC families
- 5.2.5 Anatomical diagrams with pathway-specific evidence
From cell type to behavior
5.3 Looming and descending pathways · Outline
- 5.3.1 LPLC2, LC4 and the evidence for looming-related processing
- 5.3.2 DNp01/giant fiber and escape-related pathways
- 5.3.3 Descending versus ascending information
- 5.3.4 Inputs, outputs, location and uncertainty in cell-type dossiers
- 5.3.5 Robotics analogies must be separated from fly function
5.4 Dataset comparison as an experiment · Outline
- 5.4.1 Read official release notes and licenses
- 5.4.2 Record segmentation and annotation versions
- 5.4.3 Reconstruct a small pathway from source queries
- 5.4.4 Cross-check morphology and connectivity
- 5.4.5 Report unverified functions rather than filling gaps
Read with the original sources.
These readings support the concepts and deeper investigation. The worked numbers and illustrations above are teaching examples.
Official dataset resource
FlyWire — official project and dataset resources ↗
An adult female fly brain resource. Record the exact release and annotation version; a brain dataset should not be described as a complete brain-and-body model.
Official dataset resource
MaleCNS — official release and downloads ↗
The official download page exposes versioned data, including v1.0 resources. Keep specimen, release, filtering and annotation provenance with every derived graph.
Primary paper
Maisak et al. (2013): a directional tuning map ↗
Experimental work on direction-selective T4/T5 populations and ON/OFF motion. Ask how tuning was measured and what the measurements do not establish.
Primary paper
Klapoetke et al. (2017): radial motion opponency ↗
A study of LPLC2 looming selectivity. Compare outward expansion with translation, contraction, and brightness controls.