What you will learn
Produce a literature matrix, reproducible baseline, experiment report, and paper draft with honest limitations.
Before you begin: Foundations: matter, mathematics & computation; Connectomics: wiring as data
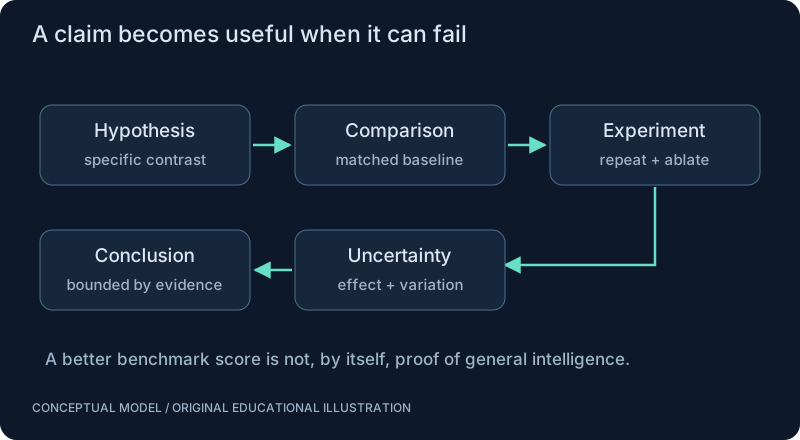
Read for the claim, not the headline
Identify the problem, previous limitation, method, assumptions and actual evidence. A paper can propose a useful method without validating every possible application. Trace important statements to experiments or derivations. A review is a map into primary literature; it is not a replacement for checking the original conditions.
Design an experiment that can disagree with you
Choose the baseline, primary outcome and evaluation cases before extensive tuning. Use independent runs when estimating variability. Repeated frames from one trajectory are not equivalent to independent experiments. Distinguish practical effect size, uncertainty and statistical testing; they answer related but different questions.
Communicate a reproducible result
Report configurations, dataset versions, seeds, hardware, preprocessing and failures. Include ablations that could undermine the preferred explanation. A clear limitations section strengthens the reader’s ability to judge the contribution. Writing a draft is an engineering milestone; acceptance through peer review is a separate external outcome.
Neural-network perspective
Architecture research often changes more than one thing at once. Matching parameter count is not the same as matching compute, and matching compute is not the same as matching information. State which comparisons are fair for the question you ask. The paired example below illustrates accounting, not a publication-ready analysis.
SEE THE RELATIONSHIPS
From structure to behavior.
MAKE THE IDEA PRECISE
The mathematics.
| Symbol | Meaning |
|---|---|
| i | Matched independent experimental run |
| score | Predefined task metric on the same evaluation scale |
| delta_i | Within-pair difference; pairing must be justified |
Build the equation, step by step
- Define the measured quantity and its desirable direction before comparing systems. Subtract baseline from candidate for each matched run.
- Keep the individual differences alongside the mean. Averages can hide a failure mode or a dependence on one favorable seed.
- Connect the numerical result to a limited claim, report uncertainty and resource budgets, and provide the protocol needed for someone else to test it. Negative or inconclusive results are still evidence.
WORK THROUGH THE NUMBERS
Worked example
Baseline results [0.70, 0.72, 0.68] and candidate results [0.74, 0.73, 0.72] yield differences [0.04, 0.01, 0.04], averaging 0.03. These are invented teaching numbers, not measured performance.
A small Python experiment.
Python 3 · Standard library only · Synthetic educational example. Run this in your own notebook or a local file.
from statistics import mean
baseline = [0.70, 0.72, 0.68]
candidate = [0.74, 0.73, 0.72]
delta = [b-a for a,b in zip(baseline,candidate)]
print([round(x,2) for x in delta])
print(f"mean difference = {mean(delta):.2f}")
Expected output
[0.04, 0.01, 0.04]
mean difference = 0.03
Change one quantity, predict the result, and then run the code again. Explain any difference before adding complexity.
Test your understanding.
Try it: Write a one-page protocol for one project, including a result that would count against your idea.
Self-check: What would count as a useful negative result?
A reproducible comparison showing that the proposed mechanism fails to improve the chosen outcome under clearly defined conditions. State what was tested, what the experiment could detect, and what remains unresolved. Do not turn failure in one setup into a universal impossibility claim.
Where this model stops: Neither three runs nor a positive mean alone establishes a reliable scientific improvement.
A research question: Can someone else reproduce your conclusion using only your report and public artifacts?
Record evidence in your mastery worksheet →THE NEXT LAYER
Chapter depth map.
This introduction provides a first model. The following chapters are outlines for deeper future editions; their full treatments have not yet been published.
Read and question
25.1 Reading a paper · Outline
- 25.1.1 Problem and previous limitation
- 25.1.2 Method, equations and assumptions
- 25.1.3 Experimental design and actual results
- 25.1.4 Limitations, competing explanations and reproducibility
- 25.1.5 What changed and what remains unproven
25.2 From literature to hypothesis · Outline
- 25.2.1 Search primary literature and official resources
- 25.2.2 Track versions, datasets and negative results
- 25.2.3 Build a claim/evidence matrix
- 25.2.4 Form falsifiable hypotheses
- 25.2.5 Define scope and feasibility before implementation
Test and communicate
25.3 Experiments that answer a question · Outline
- 25.3.1 Baselines and ablation studies
- 25.3.2 Independent runs, uncertainty and effect sizes
- 25.3.3 Statistical significance versus practical importance
- 25.3.4 Benchmark leakage, confounders and compute parity
- 25.3.5 Reproduction manifests and release checklists
25.4 Writing and peer review · Outline
- 25.4.1 Methods precise enough to reproduce
- 25.4.2 Results figures and uncertainty
- 25.4.3 Limitations and alternative interpretations
- 25.4.4 Writing abstracts, papers and rebuttals
- 25.4.5 Peer review and publication are not guaranteed outcomes
Read with the original sources.
These readings support the concepts and deeper investigation. The worked numbers and illustrations above are teaching examples.
Primary paper
Shiu et al. (2024): a Drosophila computational brain model ↗
A connectome-based computational model of sensorimotor processing. Separate experimentally tested predictions from the model assumptions and untested behaviors.
Primary paper
Lin et al. (2024): network statistics of the fly connectome ↗
Study motif and network analysis with attention to filtering and null-model choices. Graph centrality is not automatically causal importance.